Viewing the Analog Data
If you select 'Analog Data View'(or Data View) at object related to analog of Entire Tags, Analog Inputs, Analog Detail and Graphics, Analog Data View screen is opened such as <Figure 1>.
You can see data(Average, Min, Max, Sum) for analog input tag during designated time(Minutely, Hourly, Daily, Weekly, Monthly), at Analog Data View screen.
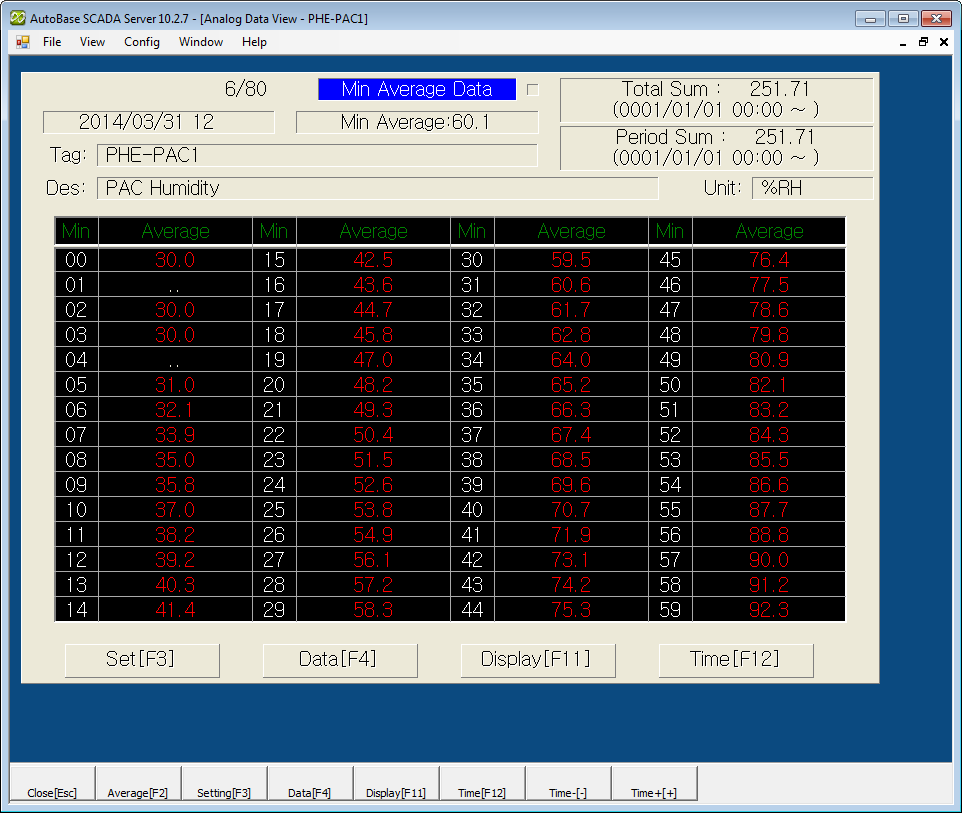
<Figure 1> Example for Analog Minutely Data View screen
You can set Data View Max/Min, Display Type(Numeric, Bar, Line), Display
Option, Sum Setting, Total Sum Start Time, etc which are displayed at Data
View screen by selecting 'Analog Data
View Settings' of
shortcut menu or
![]() and
and
![]() button.
button.
If you select
![]() button of data view menu button, you can view data by changing data type as
order of average -> min -> max -> sum.
button of data view menu button, you can view data by changing data type as
order of average -> min -> max -> sum.
If you select ![]() or
or
![]() button, you can view data by changing date type as order of minutely ->
hourly -> daily -> monthly.
button, you can view data by changing date type as order of minutely ->
hourly -> daily -> monthly.
Also, if you select
![]() or
or
![]() button, you can view data by changing
data display type as order of numeric -> line
graph - > bar graph.
button, you can view data by changing
data display type as order of numeric -> line
graph - > bar graph.
Data view start time can be
set by selecting
![]() or
or
![]() button.
button.
Also, if you select
![]() or
or
![]() button, you can increase or decrease data view start time as 1hour ~ 1year
interval(proportional to entire time of data view).
button, you can increase or decrease data view start time as 1hour ~ 1year
interval(proportional to entire time of data view).
At analog data view screen, if press Page Up and Page Down key, you can view data for previous or next analog input tag.(But, if inactivated tag exists, move to previous or next tag...)
You can set background color, font, text size, etc of Analog Data View at 'Config | Colors' and 'Config | Font' menu.
There are menu buttons below analog data view screen such as
![]() ,
,
![]() ,
,
![]() ,
,
![]() ,
,
![]() ,
,
![]() ,
,
![]() ,
,
![]() .
.
If you press mouse right button at analog data view screen, shortcut menu of analog data view is shown such as <Figure 2>.
You can work on moving to other menu or setting, etc by using shortcut menu and menu button as follows.
Close : You can close analog data view screen by selecting
![]() button.
button.
Changing Data Value : If you select
![]() button, you can view data by changing data type as
order of average -> min -> max -> sum -> entire.
button, you can view data by changing data type as
order of average -> min -> max -> sum -> entire.
Data View Setting : You can set min/max
etc value of graph by selecting
![]() button or 'View Settings' of shortcut menu.
button or 'View Settings' of shortcut menu.
Changing Data View : You can change data as order of minutely -> hourly ->
daily -> weekly -> monthly by selecting ![]() (or
(or
![]() ).
).
Changing Display : You can change data display type as order of numeric ->
line graph -> bar graph by selecting
![]() (or
(or
![]() )
button.
)
button.
Data View Start Time : If you press
![]() button
or F12 key, you can set data view start time. (Also, possible to be set by
button
or F12 key, you can set data view start time. (Also, possible to be set by
![]() button
of data view screen)
button
of data view screen)
Increasing/decreasing Data View Start Time : You can increase/decrease the
data view start time as 1 hour ~ 1 year intervals by selecting
![]() and
and
![]() button. (proportional to entire time of
data view)
button. (proportional to entire time of
data view)
Analog Trend for 1 Hour ~ 30 Days : Move to Trend for 1 Hour ~ 30 Days screen by selecting 'Analog Trend for 1 Hour ~ 30 Days' of shortcut menu.
Minutely ~ Monthly Data : You can change data time by selecting 'Analog Minutely ~ Monthly Data' of shortcut menu.
Change Value : You can change setting value(current value) for analog input tag by selecting 'Change Value' of shortcut menu.
In case of link type is memory, system or PLC_SCAN tag and tag which AO SV was set.
Tag Properties : You can modify tag properties by selecting 'Tag Properties' of shortcut menu.
Set Temporary Value : You can set(ban the scan) or unset the temporary value for analog input tag by selecting 'Set Temporary Value'.

<Figure 2> Shortcut menu of Analog Data View
Reference) You can do Multi Data View by registering multiple analog/digital tags by using script etc.
Relate items)
Changing the Analog Data View Display
Setting the Data View Start Time
Changing the Analog Input Value
Setting the Analog Temporary Value